Process notes
△1 began straight after the two dialogues. Both had left me with the same question: how can graphic design shape what a reader notices, compares and interprets? Paul Bailey’s question, “What are you trying to share?”, also stayed with me. In Week 01 I wanted to test the question on something very small and familiar rather than on a large system: the differences between digital copies of the same image. Every image we see on screen has been resized and compressed somewhere along the way, but we rarely notice what changes. This series of sketches asks what we can notice when an image changes, and what kind of display helps us notice it.
One image
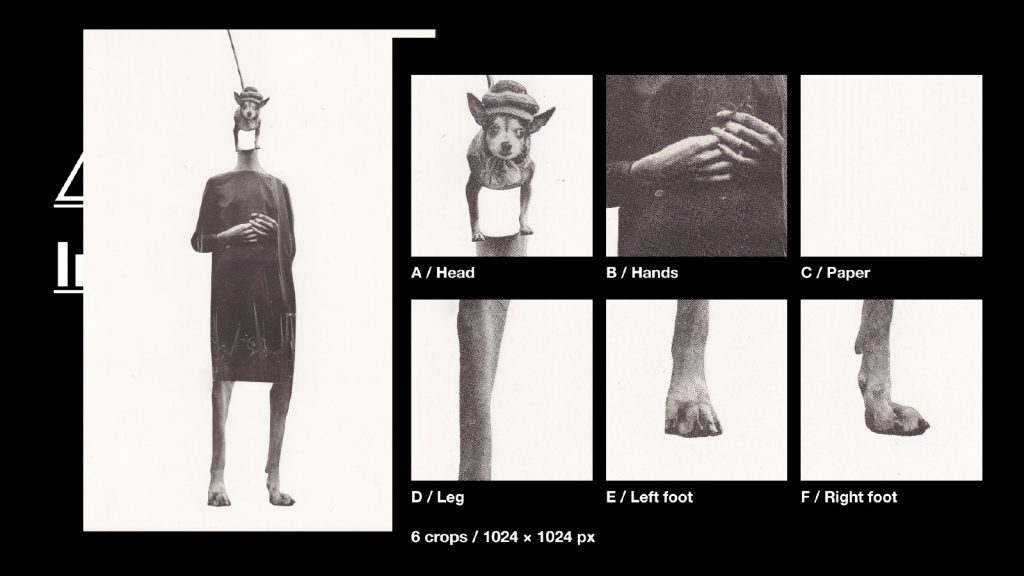
I used one of my own collages as the starting point. It came from the work I made during the Cyan workshop, which keeps a direct link between this experiment and the dialogue stage. I chose it because it contains very different kinds of detail within one surface: printed halftone dots, sharp cut edges, the texture of fabric, and areas of almost empty paper. If the same process is applied to all of them, any difference in the result has to come from the image, not from the process.
Six crops
I selected six areas of the collage: the head, the hands, the paper, the leg, the left foot and the right foot. Every crop has exactly the same size, 1024 × 1024 pixels. Fixing the size of the window lets me compare how one process affects different parts of the same image, instead of comparing different images.
Fixed rules
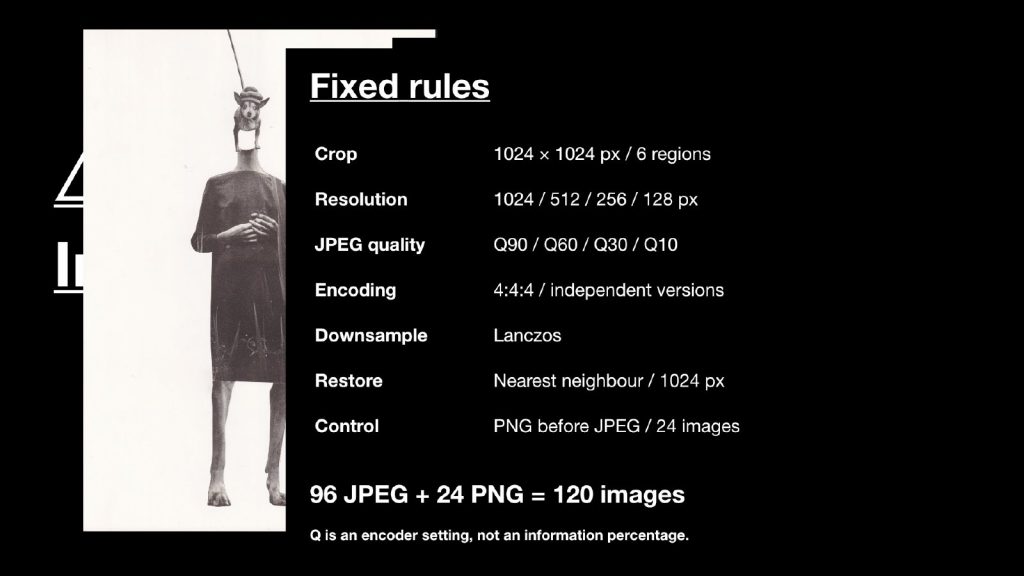
I then set two variables, image resolution and JPEG quality, and fixed everything else:
- Crop — 1024 × 1024 px, six regions
- Resolution — 1024, 512, 256 and 128 px
- JPEG quality — Q90, Q60, Q30 and Q10
- Encoding — 4:4:4, each version encoded independently from the crop, not from the previous version
- Downsampling — Lanczos
- Restoring for display — nearest neighbour, back to 1024 px
- Control — a PNG saved before JPEG compression at every resolution (24 images)
Six crops × four resolutions × four quality settings gives 96 JPEGs, plus 24 PNG controls: 120 images in total. One point matters for reading the results: the Q number is a setting of the encoder. Q60 does not mean that 60 per cent of the information is kept.
Changing one variable at a time
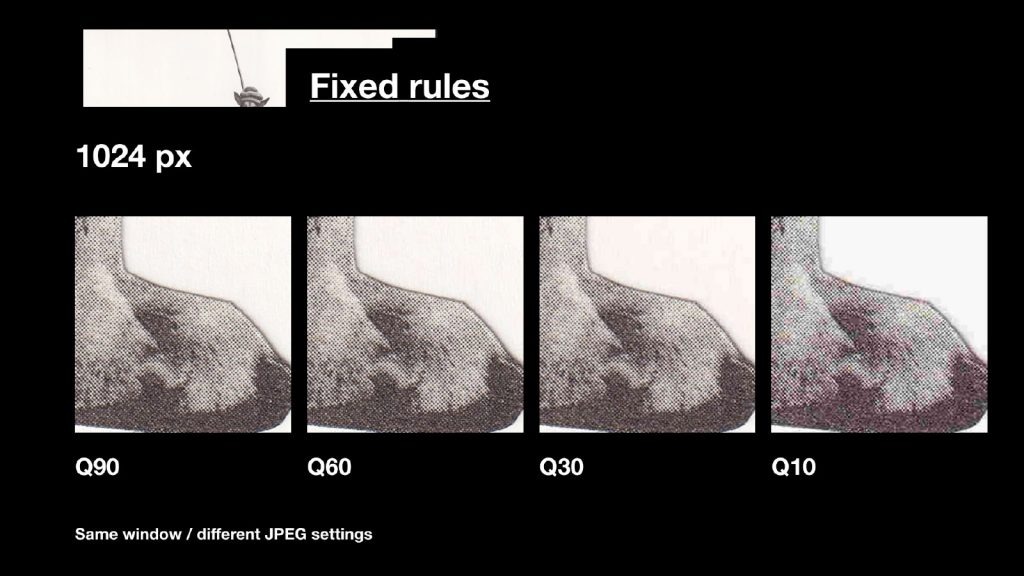
First, the resolution stays at 1024 px while the JPEG quality changes from Q90 to Q10. Comparing the same detail, the changes gather around the edges and in the printed dots.
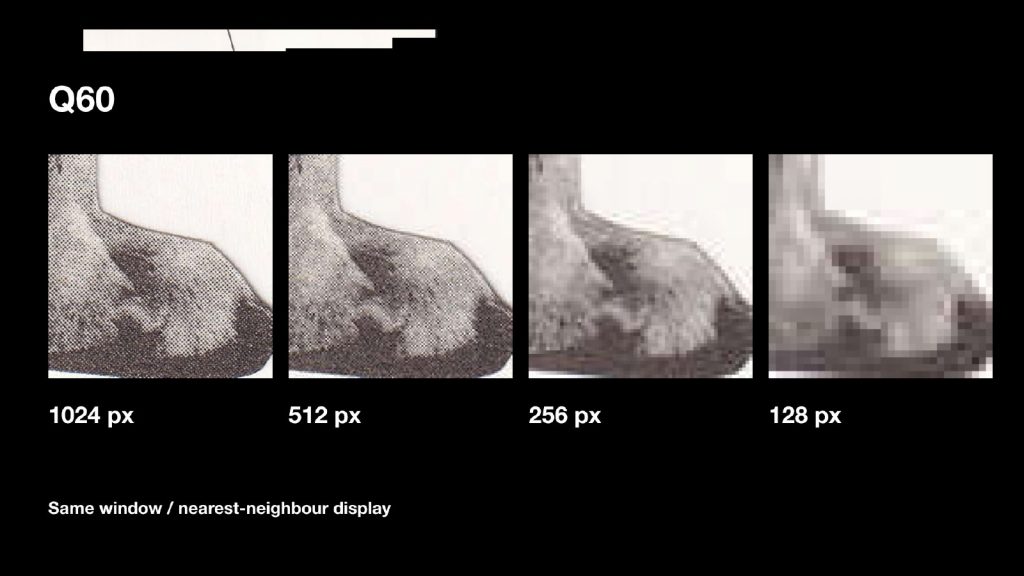
Second, the quality stays at Q60 while the resolution changes from 1024 to 128 px. I display all four versions at the same size using nearest-neighbour scaling, so instead of being smoothed, the smaller versions reveal their larger pixel grid. At 128 px the same detail becomes a mosaic.
Measuring the difference
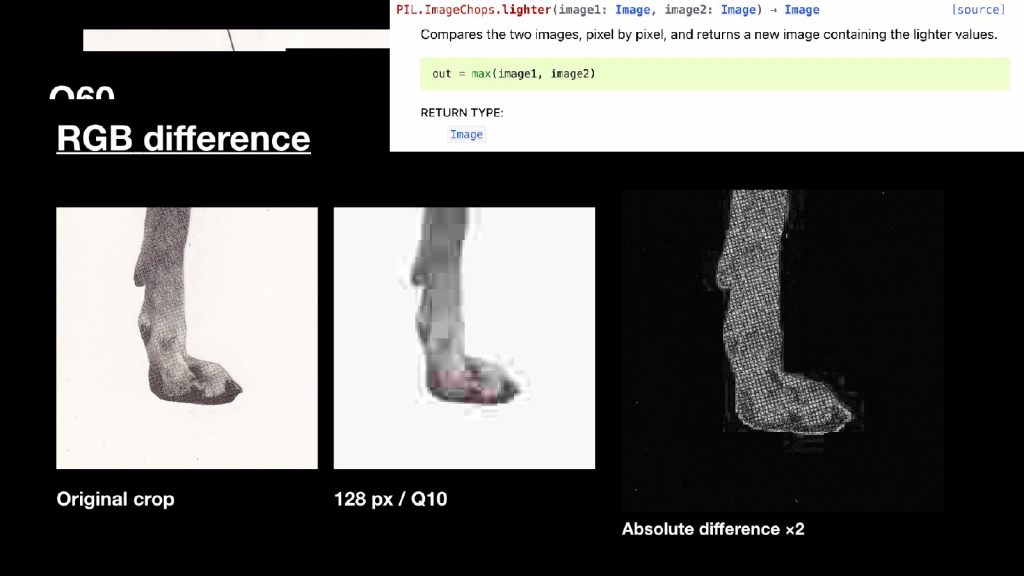
Next, I compared each processed image with the original crop, using code to calculate the absolute difference of the RGB values pixel by pixel. The result is shown as a new image: black areas changed very little, and brighter areas show larger differences between the two images. For visibility I doubled the display gain.
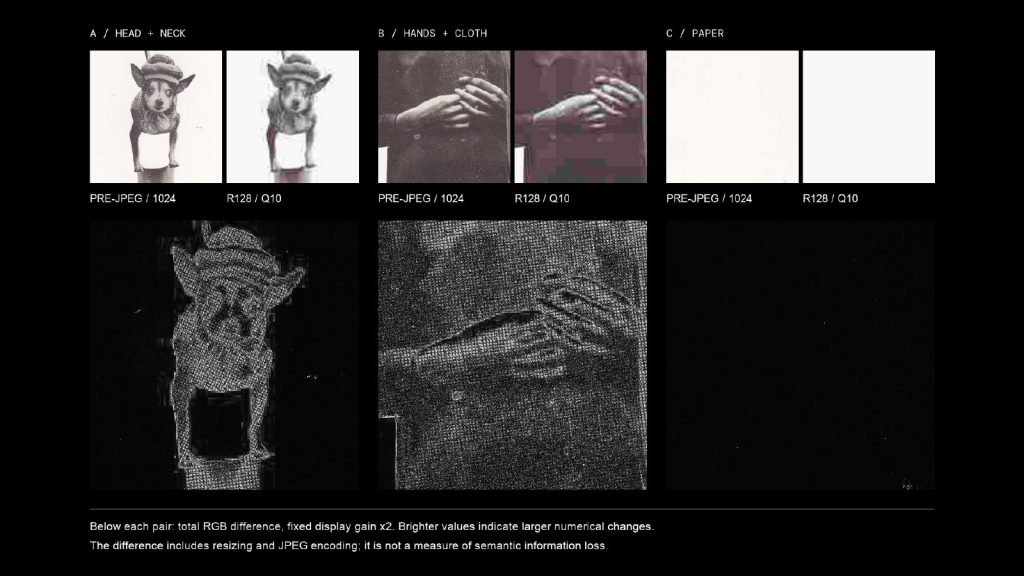
Seen side by side, the six crops react very differently to the same rules. The head and the hands, full of printed dots and edges, light up with difference; the almost empty paper stays nearly black. Underneath each pair I recorded the MAE (mean absolute error), the average pixel difference from the original crop. It is important to be precise about what this shows: it measures changes in pixel values, not how much meaning has been lost. A higher MAE means a larger numerical difference, not a percentage of lost information. The difference also includes resizing as well as JPEG encoding, which is why the PNG control saved before each round of compression is needed.
2D → 3D
I then asked whether these differences could become something we look at from another angle, rather than read as another flat chart.
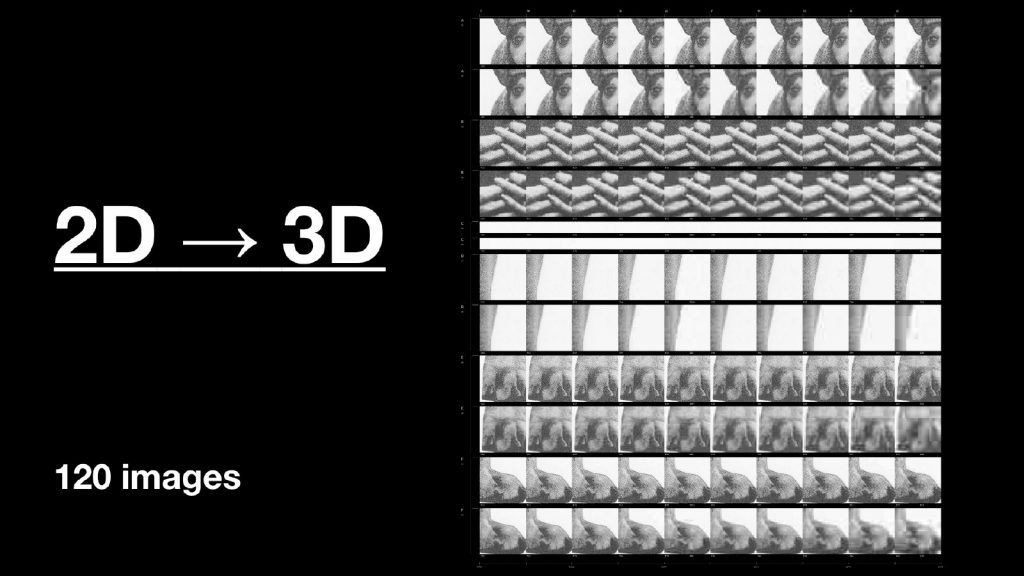
From the front, the 120 images form a dense, flat poster. The repeated layout itself invites comparison: the eye moves along rows and columns looking for what is different.
Difference → height
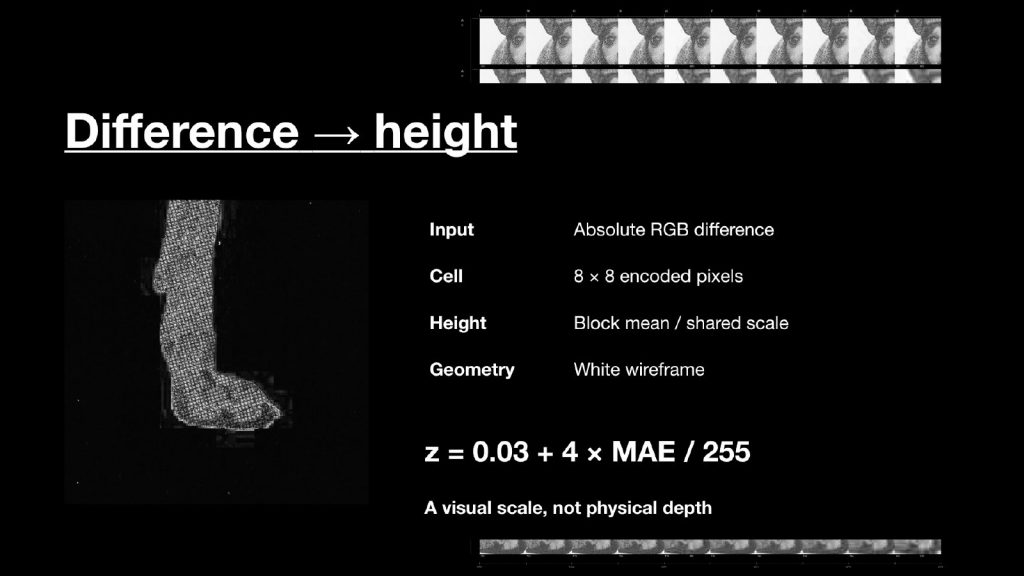
I divided the difference data into small blocks of 8 × 8 encoded pixels and turned the average value of each block into height, using z = 0.03 + 4 × MAE / 255. A larger difference creates a higher surface, and every image uses the same height scale so that the surfaces can be compared with each other. This height is a visual choice, not the real depth of the photographed object: it is a way of displaying a number, not a reconstruction of the collage.
Oblique view
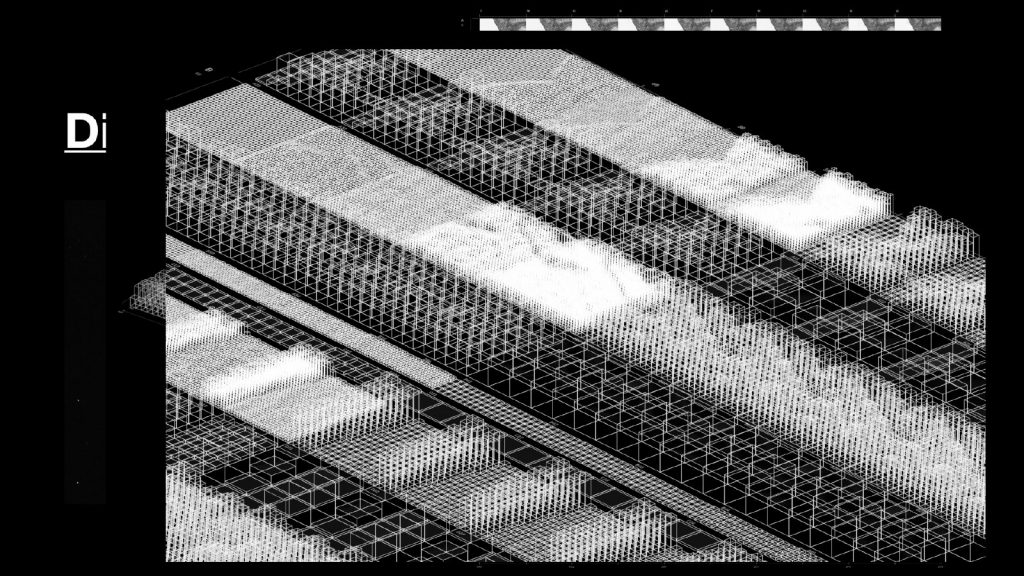
Seen from the side, the heights become visible. Thin white wireframe lines let us see overlapping structures behind each other. The model is already three-dimensional, but the images fade out as the viewing angle changes, so the front view reads as a poster and the oblique view reveals the wireframe underneath. The geometry itself stays fixed as we move around it; only what we can see of it changes.
What does the height show?
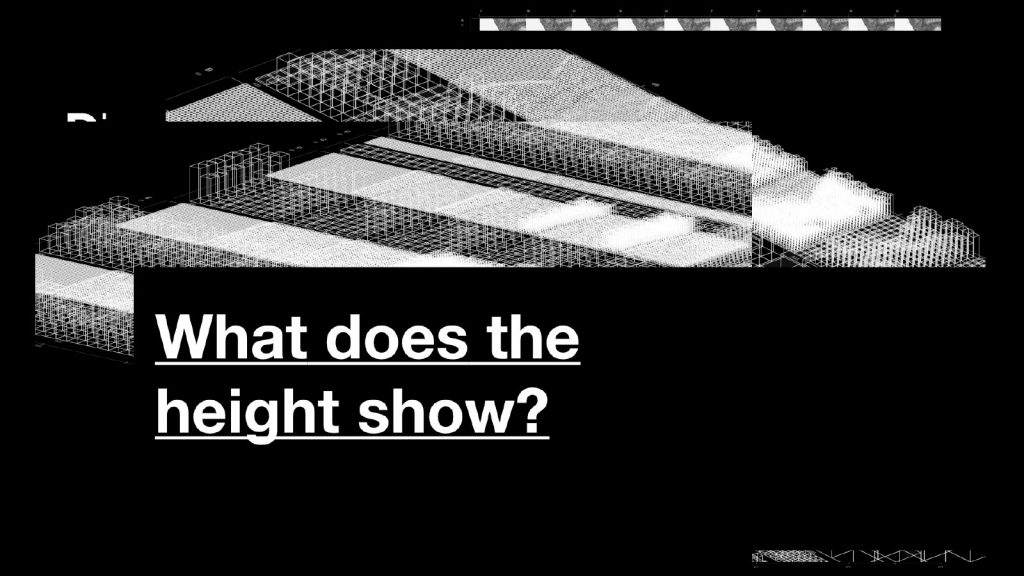
These sketches brought me back to Paul’s question: what am I trying to share? I want to make small changes between copies of an image easier to notice and compare. But I still need to test whether the height actually helps people understand those differences, or whether they mainly see an interesting shape. A display can make a difference visible and, at the same time, turn it into something else.
Questions from the presentation
- How does the front view stay an image while the side view becomes 3D? The model is always 3D. From the front, the images line up and look like a flat poster; as you move to the side, the images fade out and the white lines reveal the different heights underneath.
- Is this a code-based method, and whose method is it? Yes. Code compares the pixels of the original and the processed image. The method, absolute difference, is a standard image-comparison technique rather than any particular artist’s method; I used it to turn image differences into brightness and then into height.
- What does “PRE-JPEG PNG” mean? It is the PNG reference saved before that round of JPEG compression. It may already have been resized.
- What does MAE mean? Mean absolute error: the average pixel difference from the original crop. It is not a percentage of information lost.
Looking back, this week tested a narrow, measurable kind of change. What it could not address was where an image comes from and what surrounds it. Week 02 moved from the pixel to the archive.