WEEK_ 02
Last week, by observing the bridge underpass, I focused my direction on multi-dimensional space, and we talk about the time space underpass. This week, I continued those ideas and tried to explore ways to turn them into symbolic forms.
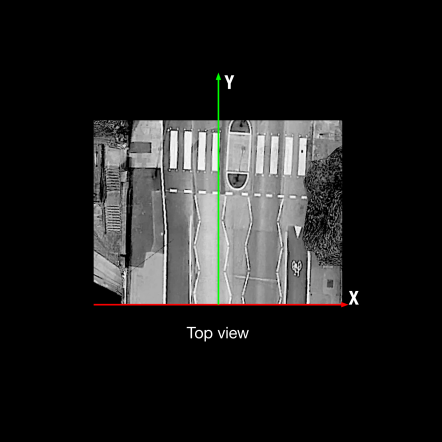
First, I chose to further develop the concept of the XY axes. I set east–west along the bridge underpass as the X-axis and north–south as the Y-axis. With that frame of reference, I used XY position to explore the differences between past and present maps about the underpass. This led me to ask: how can I use research based on XY to translate the historical changes of a 3D space into a 2D with graphic language?
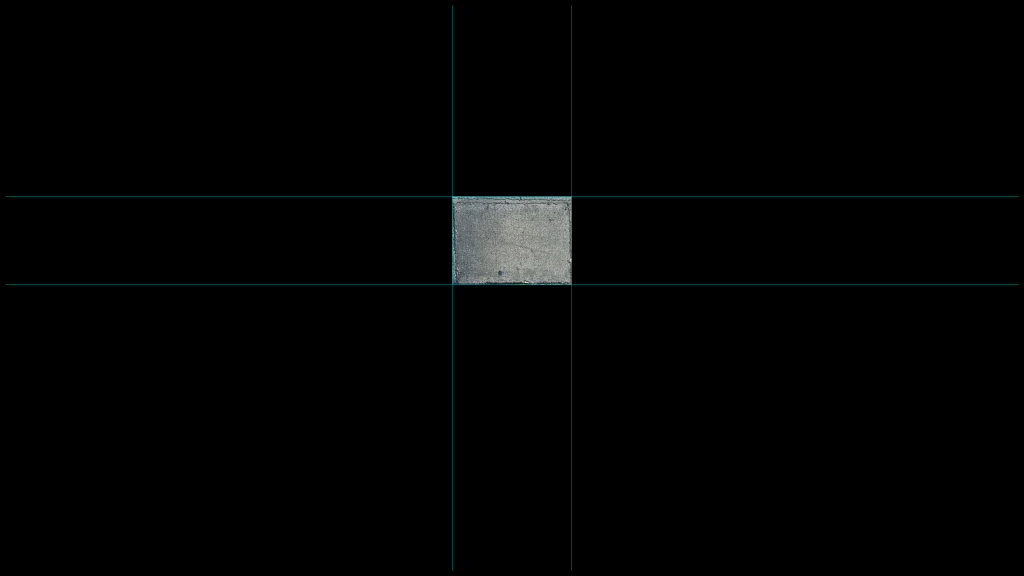
While investigating these questions, I pursued more small observations. I found bricks that appear only on the underpass. As show in this image, the left side is the intact roadway before entering the underpass, but once inside, the surface shifts to a patchwork of bricks. With this in mind, I measured, recorded, and photographed the roadway surface of the underpass.
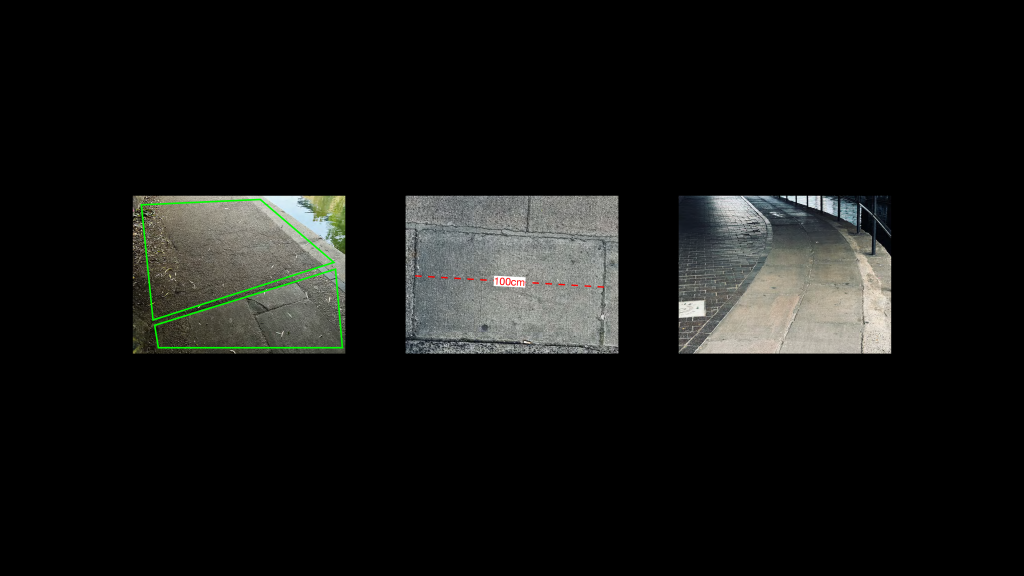

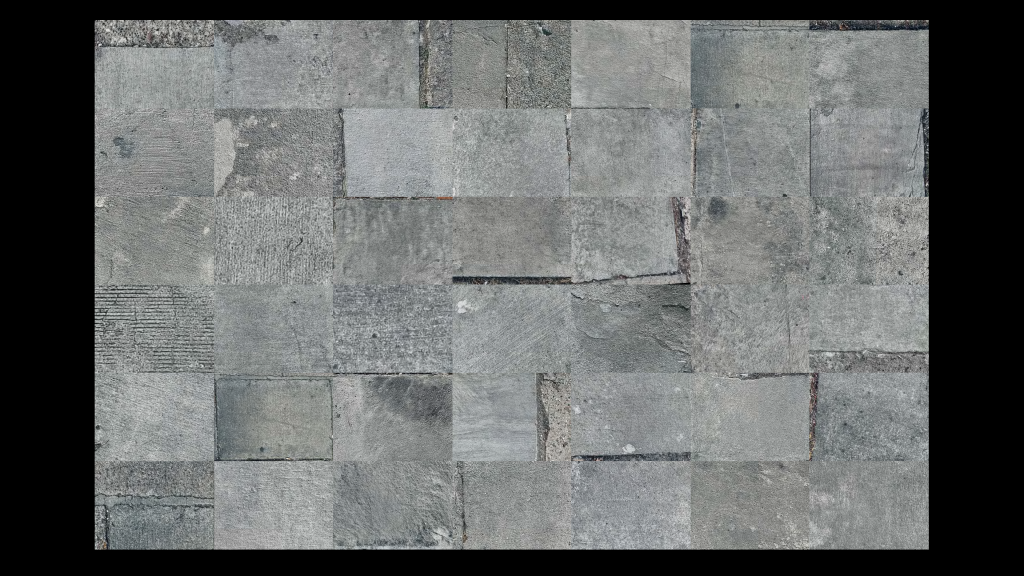
In the process, I discovered that the bricks are composed in a consistent, regular manner—like a grid system, a regular structure.
Building on that, I used the dimensions of a single brick as the basic framework to establish a graphic grid system. After that, I referenced the research approach we discussed last week, John Cage— he said“Chance music,” this is a “Boundaries and Rules,” and the combine with “Opportunity and On-site”—to think through how to translate the time–space underpass changes within this system.
WEEK_ 02

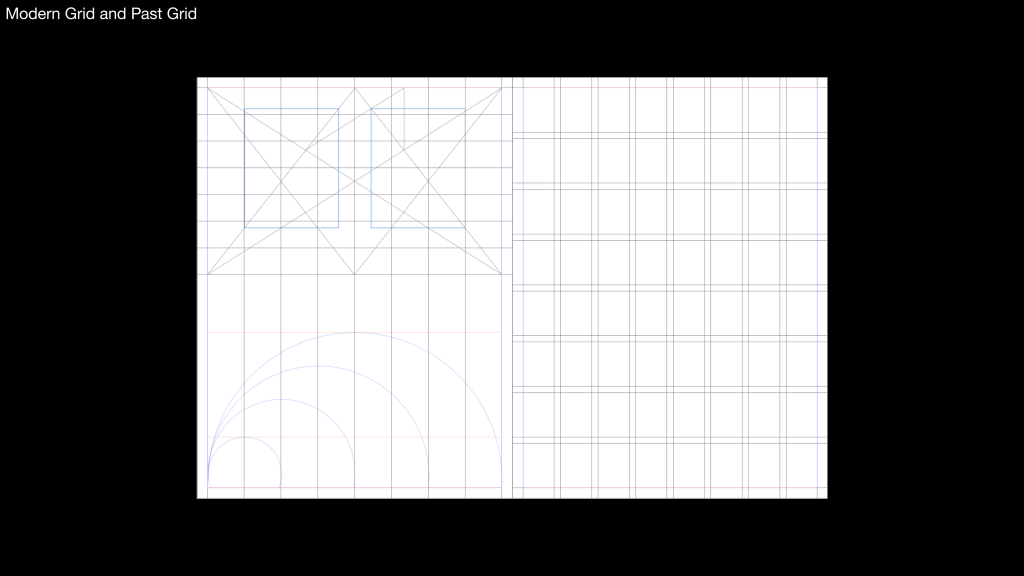
I separated the concepts of time and underpass. I connected the evolution of the grid system to the historical changes of the bridge underpass: a shift from a classical grid system to a modern grid system, signifying the passage of time in the underpass.
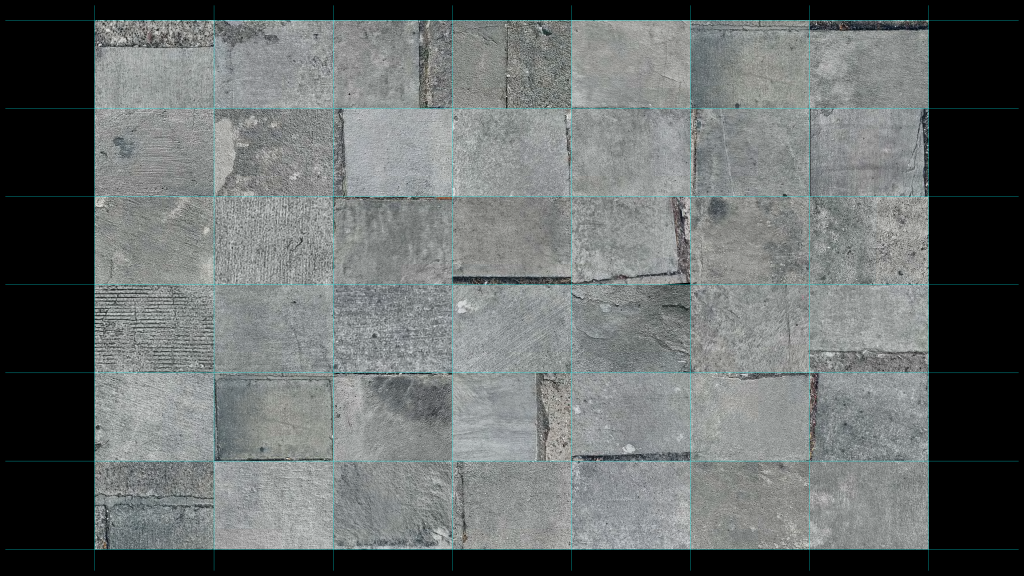
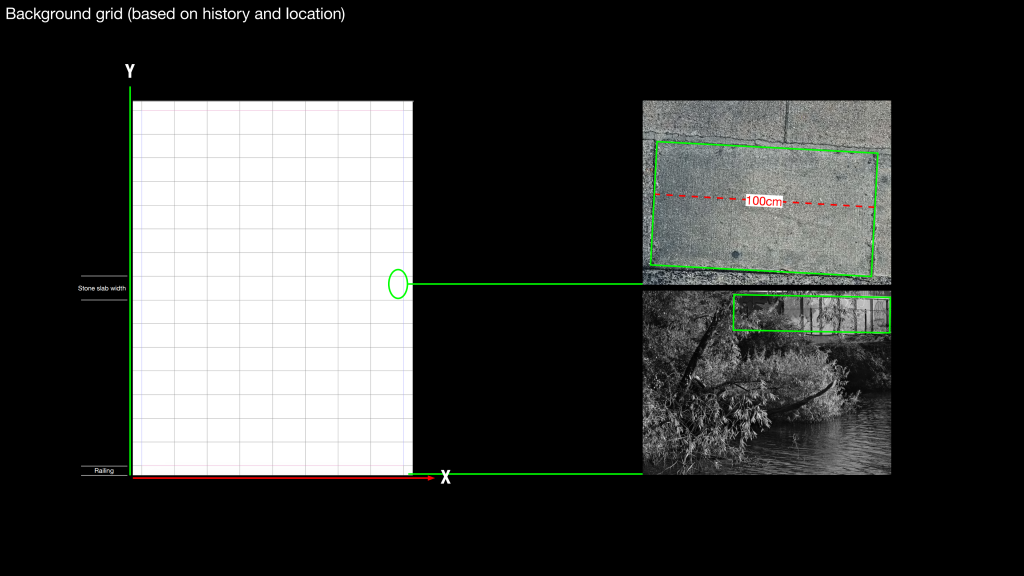
For the underpass concept, I measured dimensions of the underpass—for example, the width of the bricks and how many bricks on the underpass. Based on these, I constructed a basic grid system, using the brick as the unit of length and width and the riverside railing’s position as the margin.
WEEK_ 02
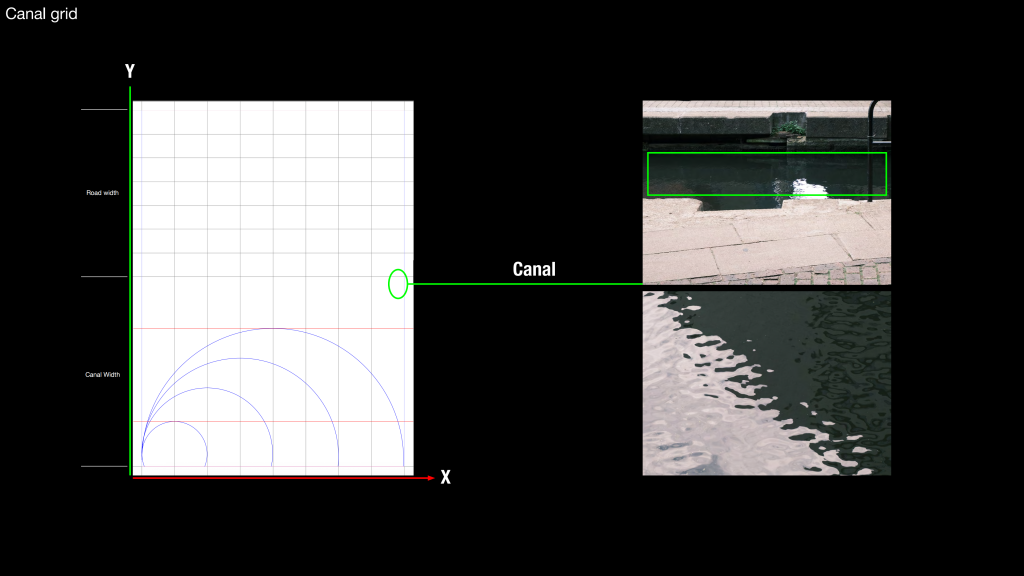
Canal grid system: I removed the lower half of the base grid system to separate the riverbank area from the water. I also studied the water flow—from west to east—and used those waves and direction to shape the grid system.
WEEK_ 02
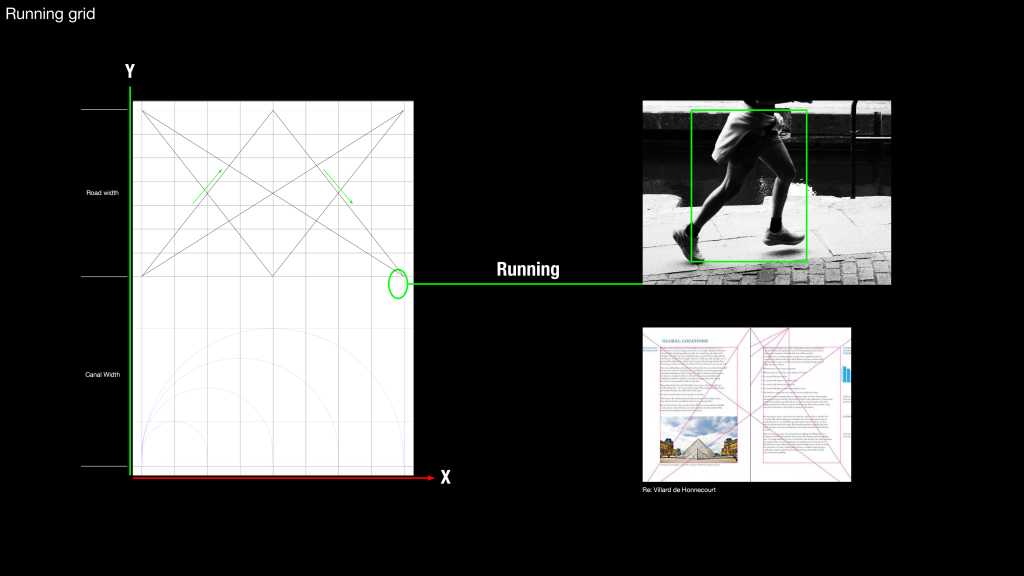
Running grid system: I recorded different runners’ directions and movements. Here I referenced Villard de Honnecourt’s traditional grid system method to find good proportions.
WEEK_ 02
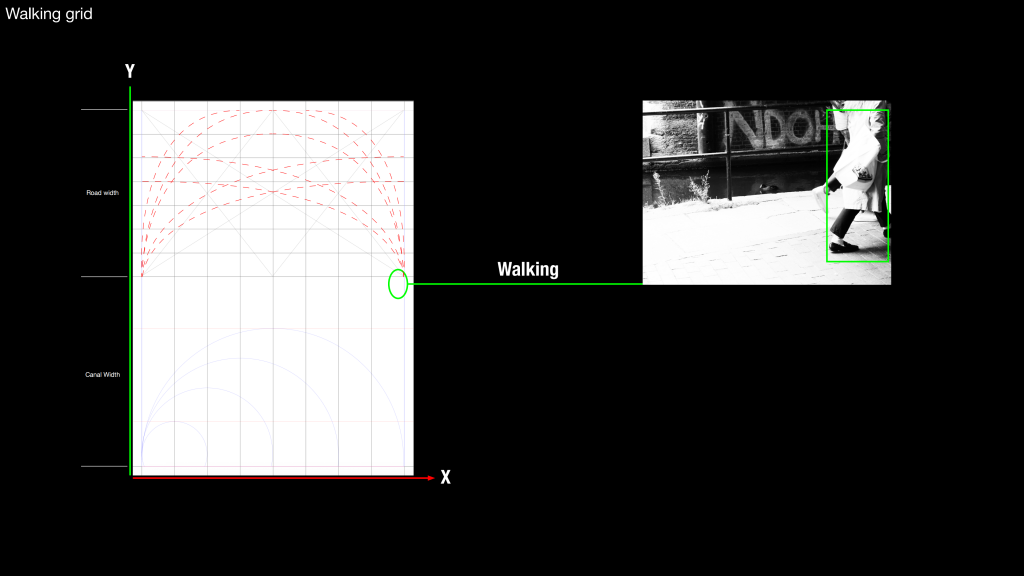
Walking grid: I tracked people’s walking paths and simplified them into a grid. Most walking routes are irregular and winding, so the grid reflects that.
WEEK_ 02
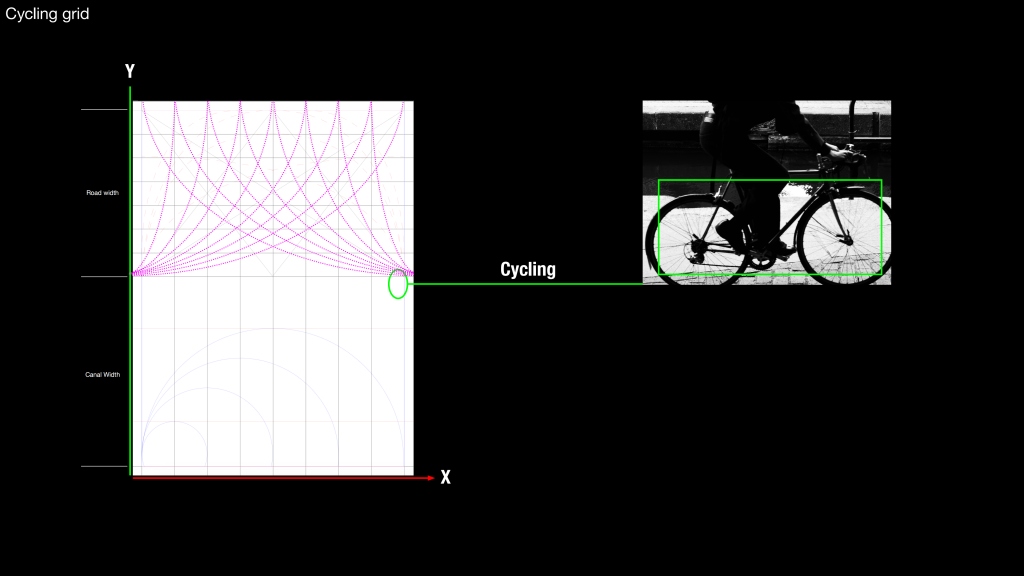
Cycling grid: I recorded cyclists’ movements. Their directions are often more consistent, but routes still change with conditions. The start and fade-out lines beyond the margins, because I noticed many cyclists join the riverside path from further side, they don’t always ride straight along the river.
WEEK_ 02
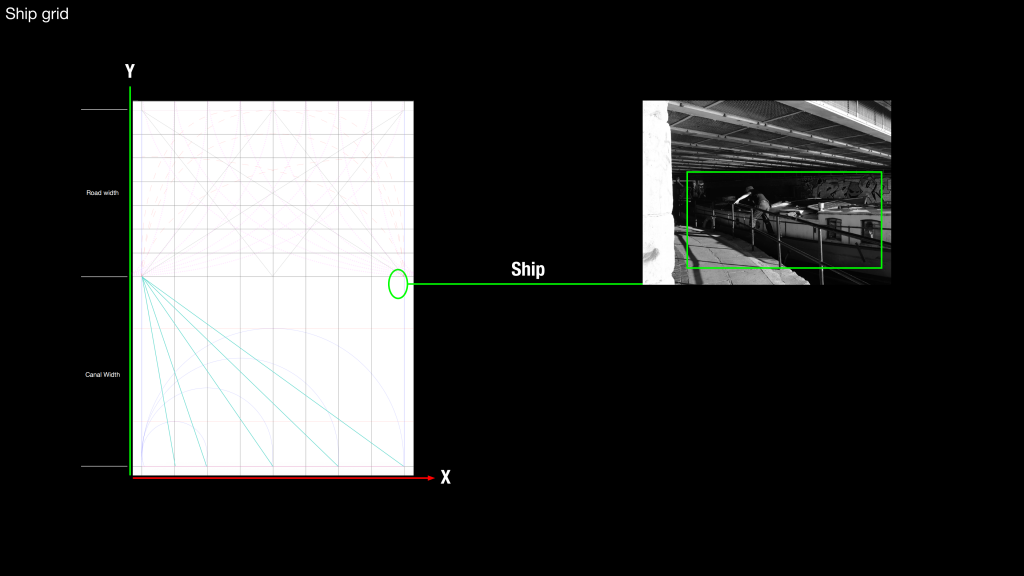
Ship grid: Ships mostly follow fixed routes at a steady speed, so this grid is very straight.
WEEK_ 02
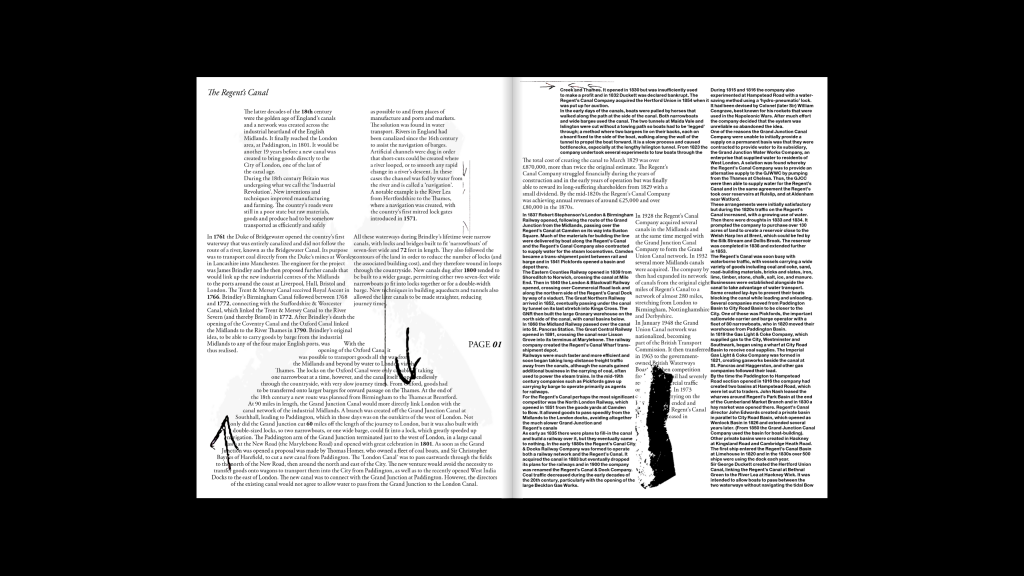
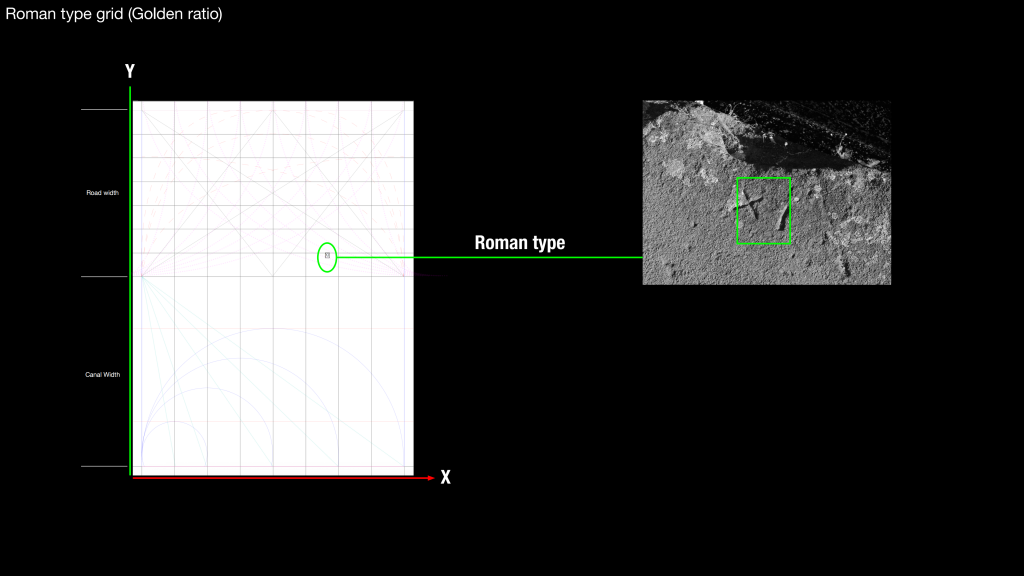
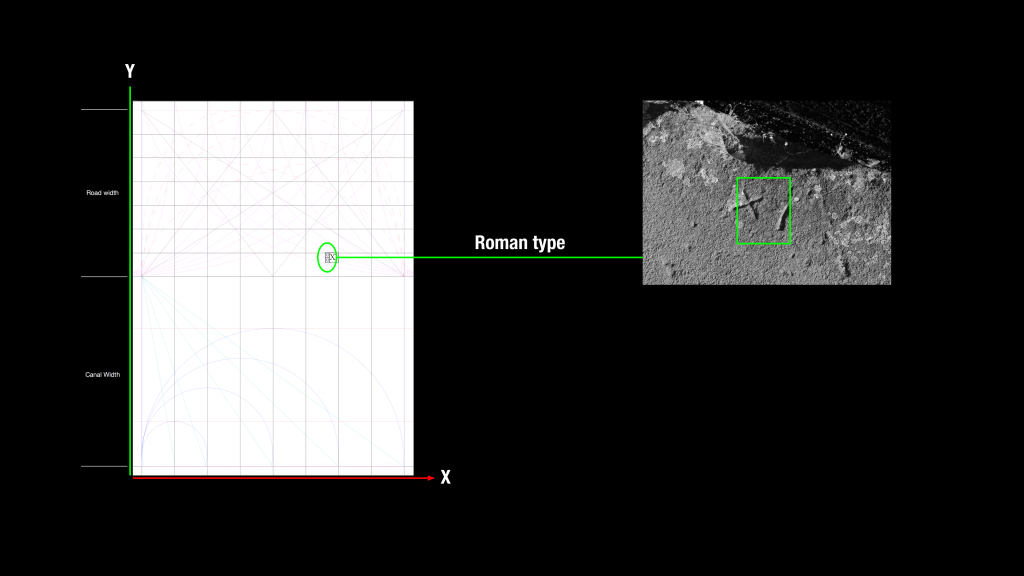
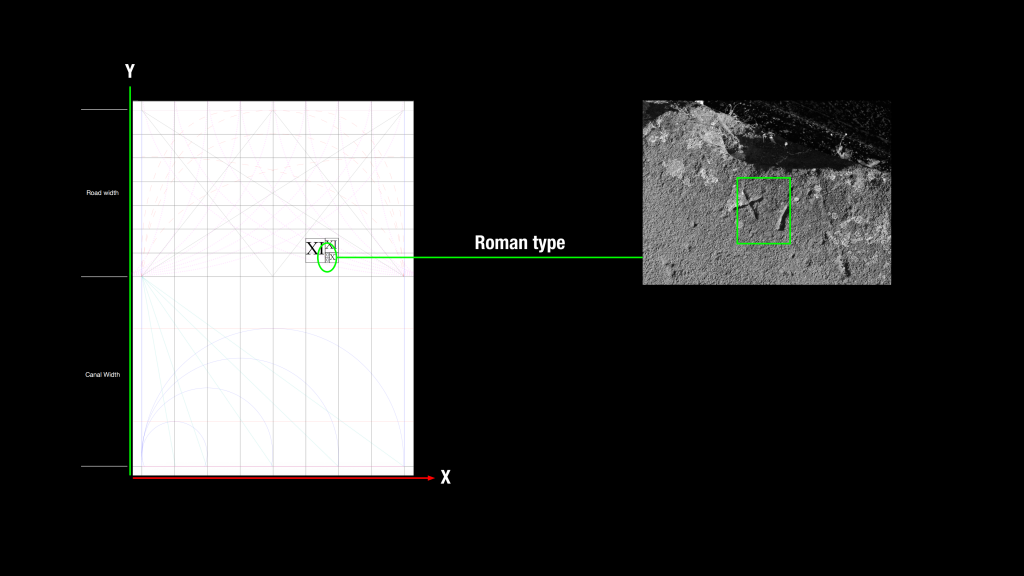
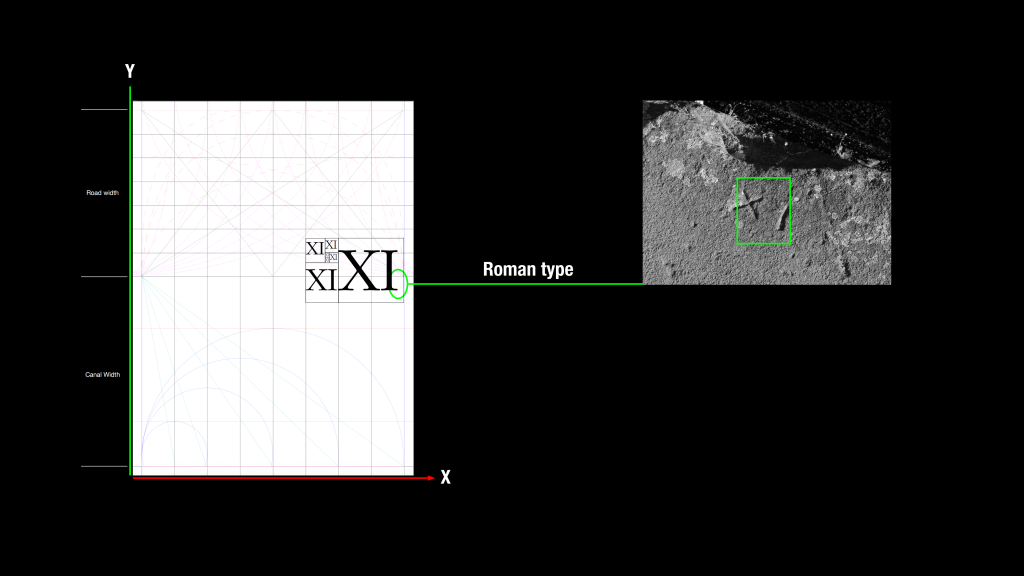
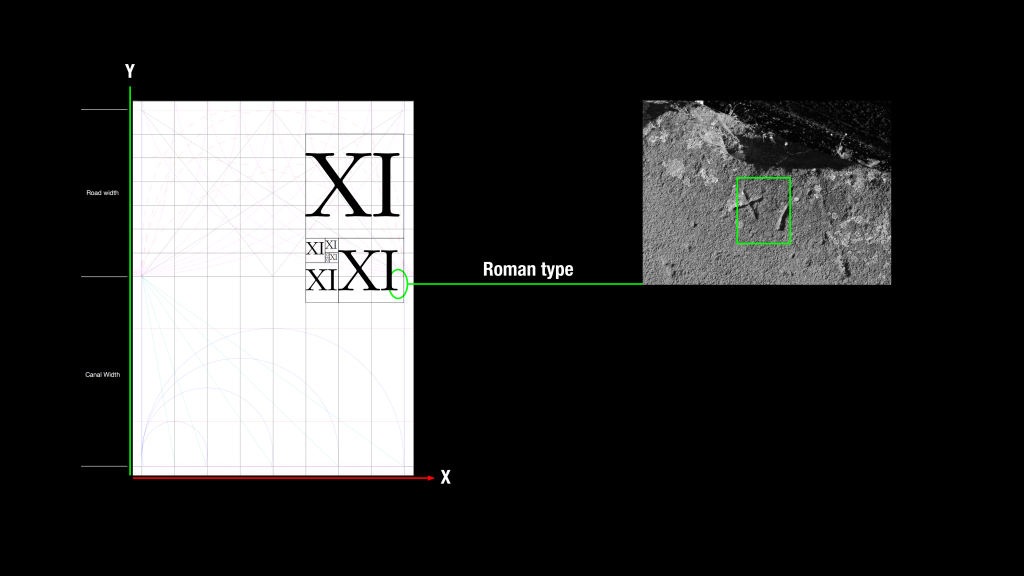
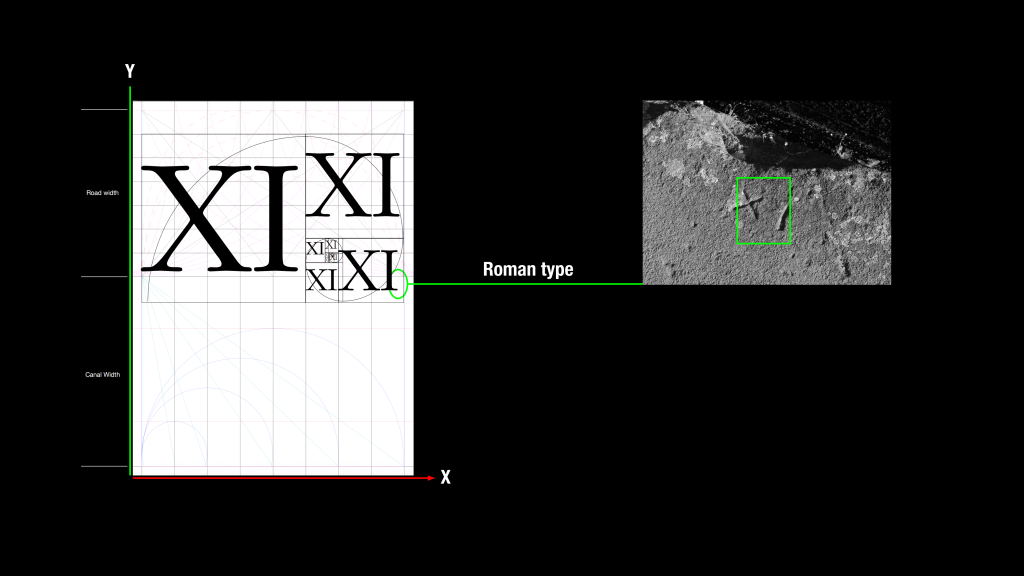
Roman type grid system: I first positioned the Roman type, so you’ll see a small font placed close to the “Canal.” On top of that, I used a traditional golden-ratio-based grid system—something with the same kind of historical depth as the type itself. This shows how a single letter can guide an entire grid system.

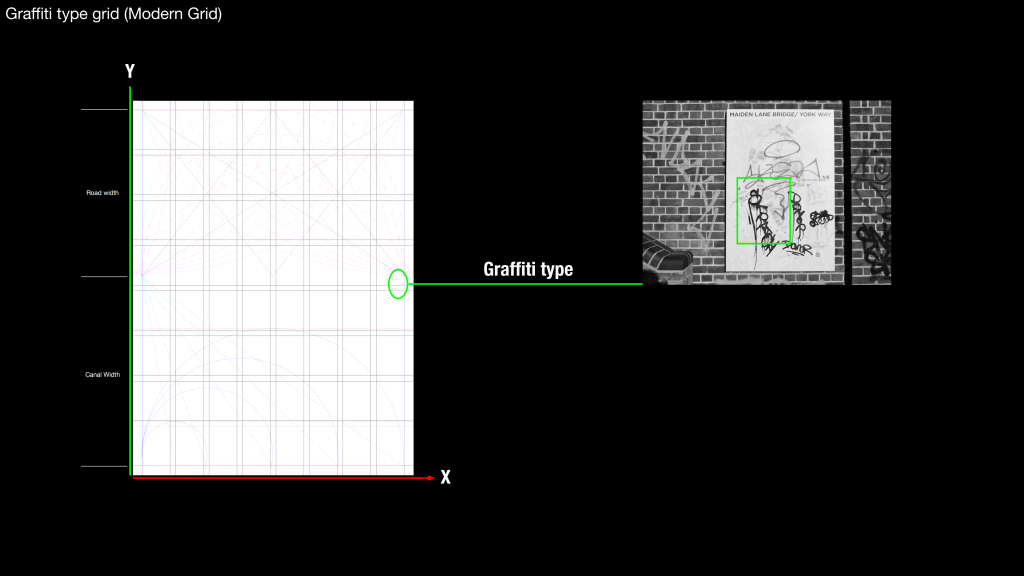
Graffiti type grid system: Since I think the grids to show historical change, I used older, classical grid systems earlier, and here I switch to a modern grid system.
WEEK_ 02
On this page, I use different grid system on a whole page. The top-left stands for the past—traditional, older grid system with more conservative Page area. With “Canal” set at the bottom-left, I move into the right-hand page where I use modern grid system. That reading flow—from left to right—presents the “time space underpass” idea: moving from past to present.
WEEK_ 02

On the next page, you can see how I use these grid systems in typography—from left to right, shifting from classic Roman type to sans serif.
WEEK_ 02