WEEK_ 03
I continued the idea of using a grid system to record observations, but with a major difference from before. I started thinking about how to translate 3D conditions into 2D language. I used a projected coordinate system.
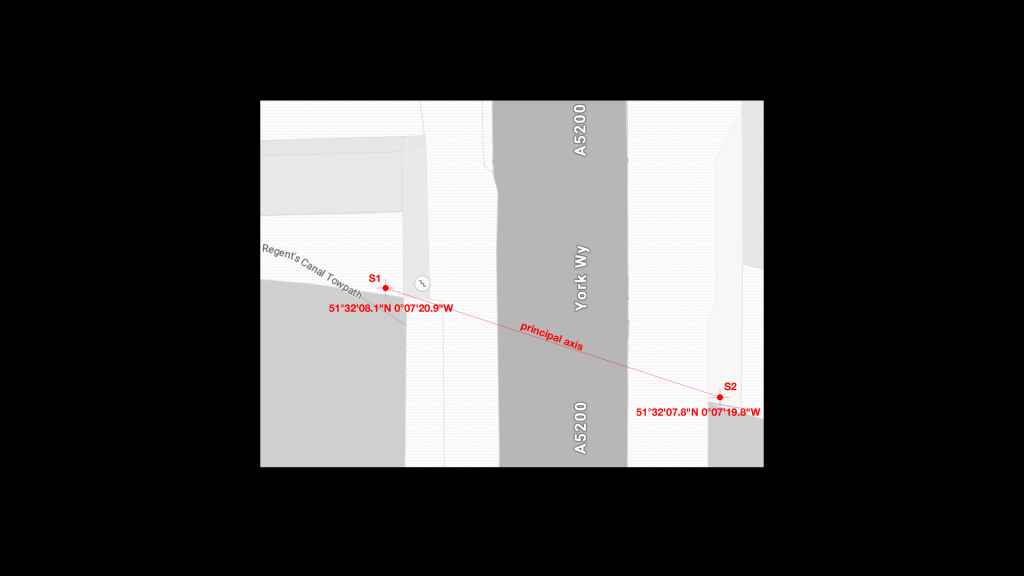
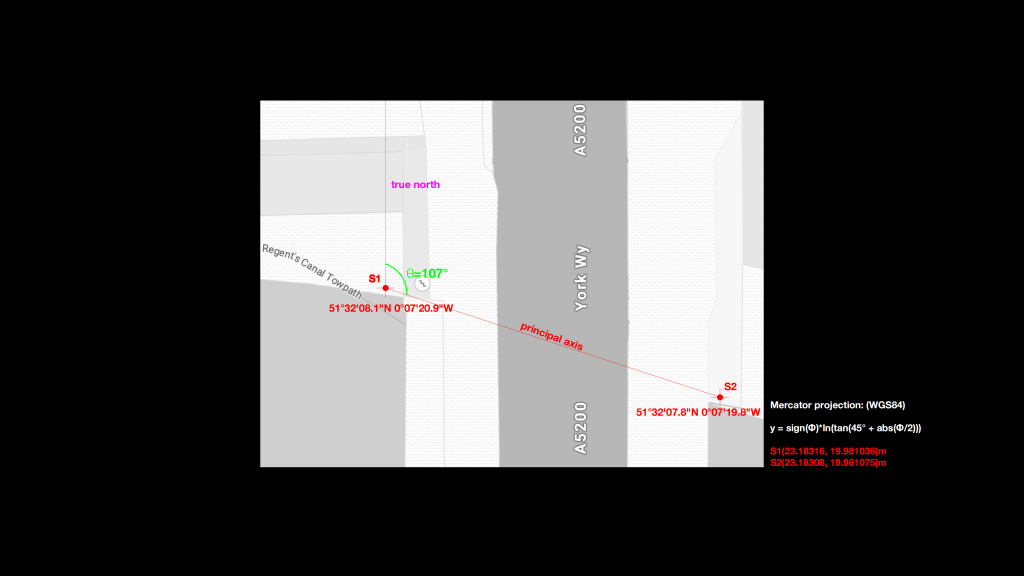
First, I defined the path between the latitude and longitude of the observation point as the “principal axis.” Then I connected the main axis with “true north,” which give me the angle θ—this angle is my fixed observation angle.
WEEK_ 03


The reason I did this is that I wanted to build a system that allows different people to observe under the same overall rules while still adjusting for themselves. If there are multiple observers, each person’s observation angle, θ, will be different, and the resulting data will be more varied and interesting.
So, I created an observation form that others besides me can use. As long as the people calculates their own coordinate system, they can compute their position on the grid according to the rules of the Mercator projection.
WEEK_ 03
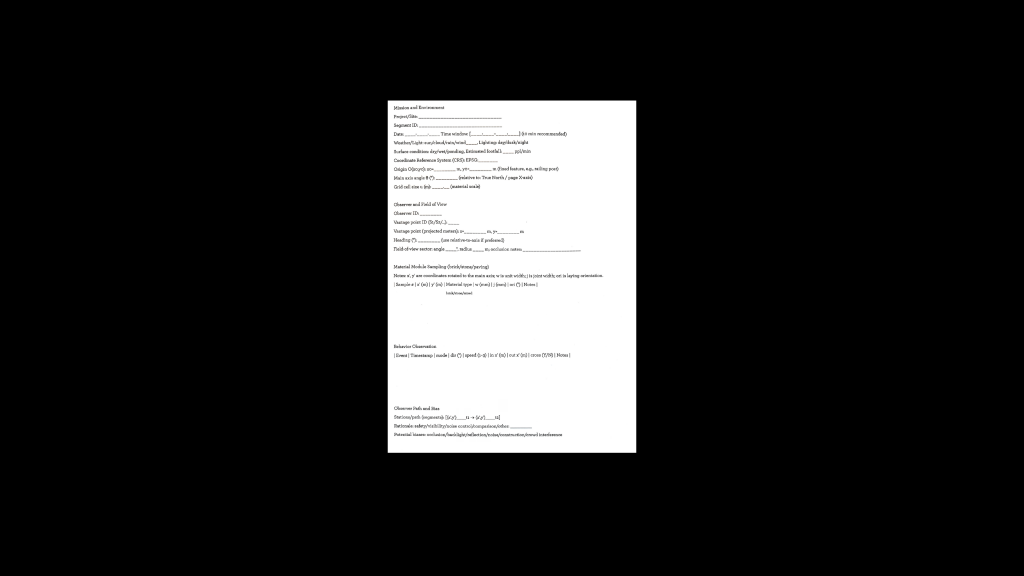
This form includes the observer’s coordinates, the projected coordinate system, and specific events that occurred within 10 minutes, including detailed information such as whether the person deviated from the principal axis.
WEEK_ 03
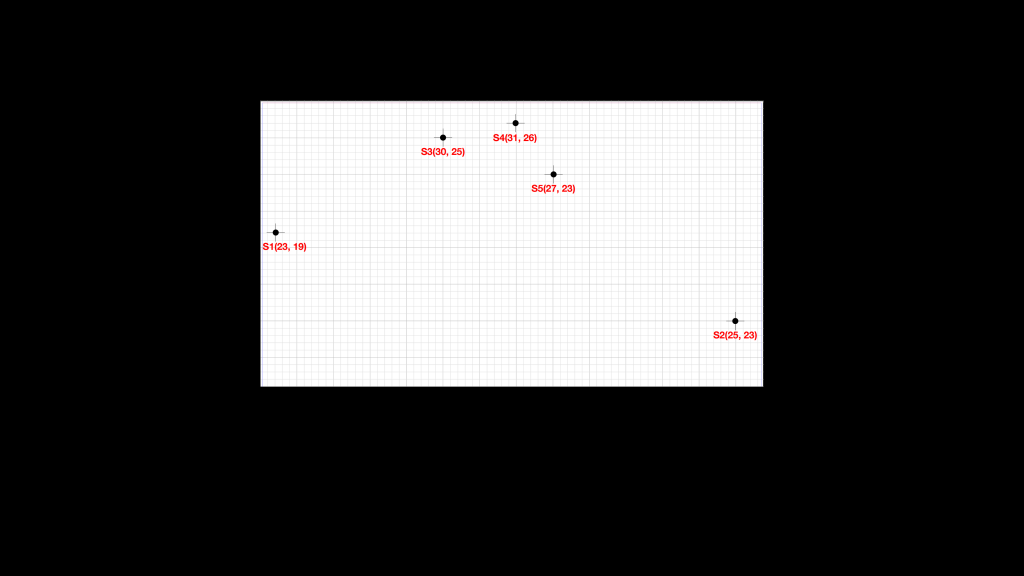
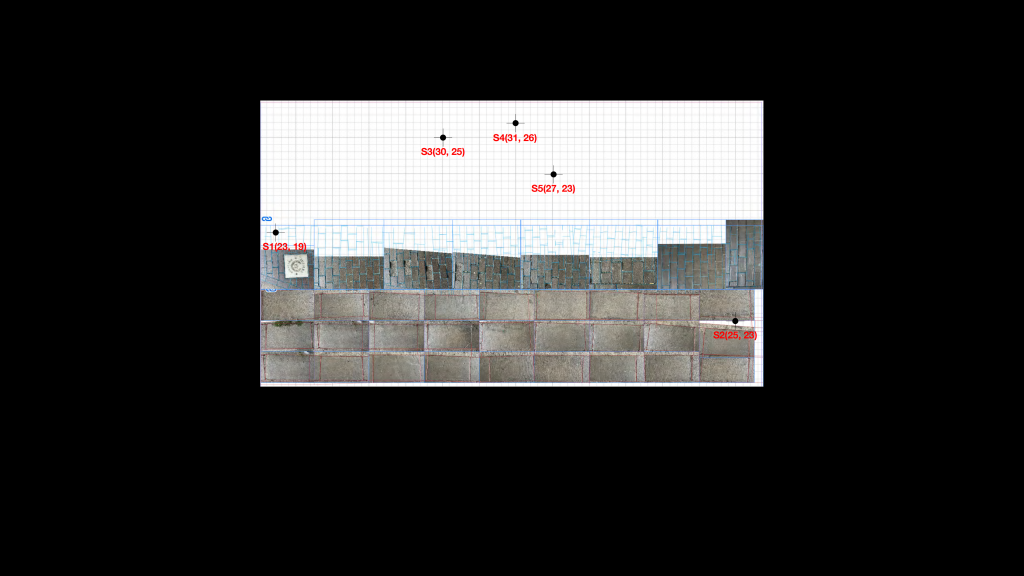
Next, I used the Mercator projection to calculate the projected coordinate system for latitude and longitude. Based on the specific X and Y values, I rebuilt the observation grid and planned my own coordinates on it.
WEEK_ 03
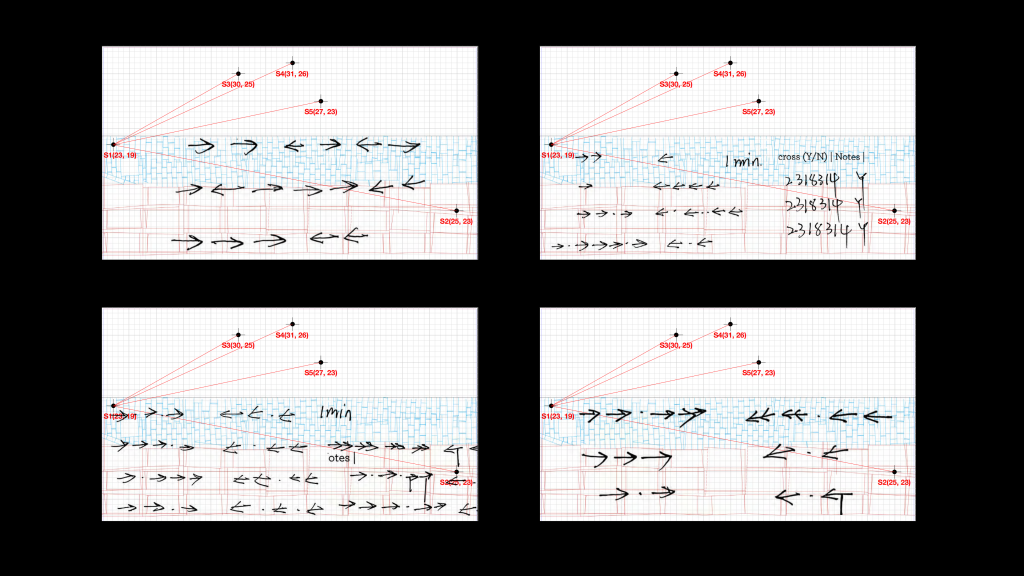
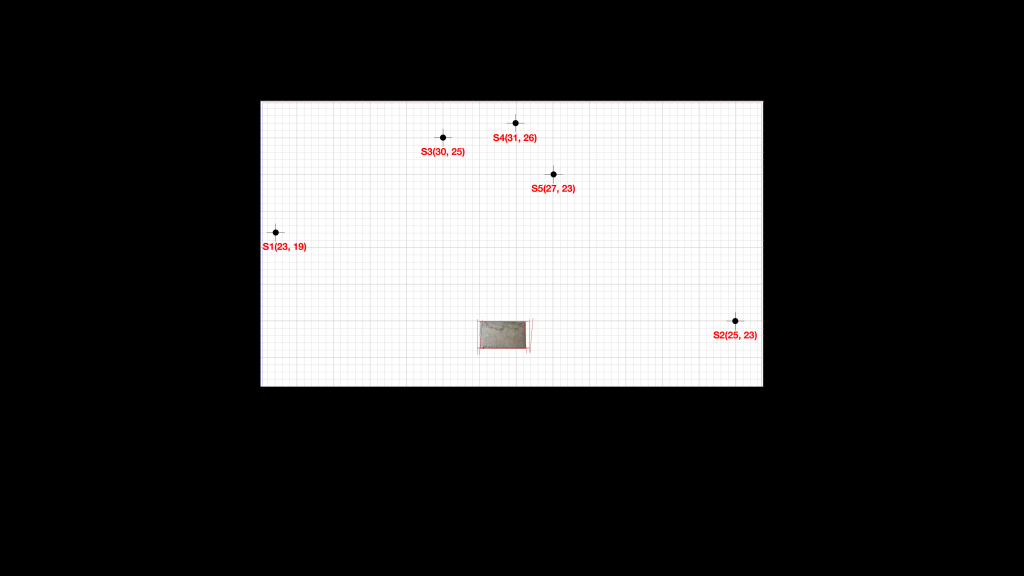
After that, I recorded the bricks under the bridge one by one and mapped their shapes and the spacing of their gaps onto the grid. Because the underpass road made up of bricks of different sizes, I drew different styles for the different bricks.
WEEK_ 03
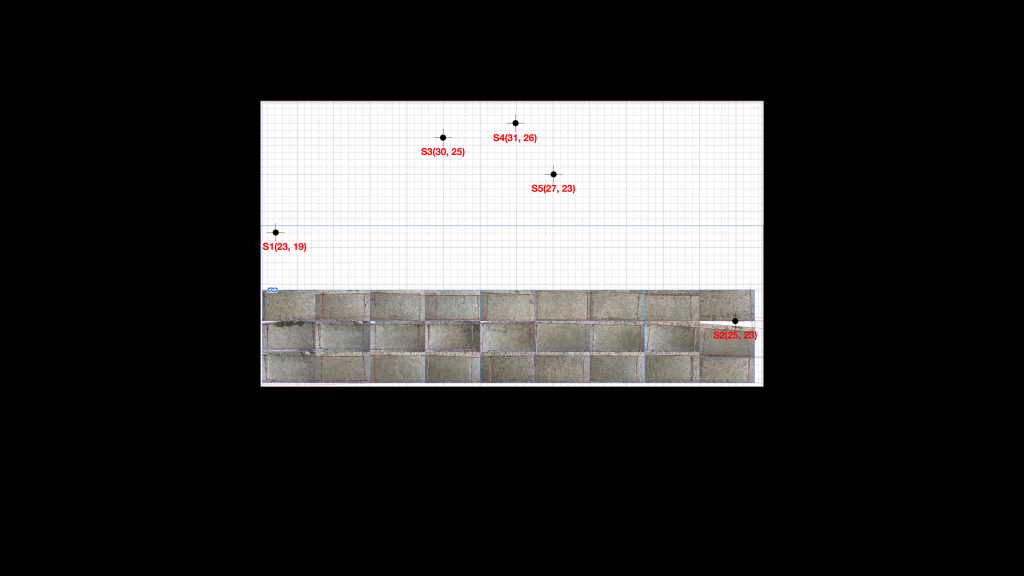
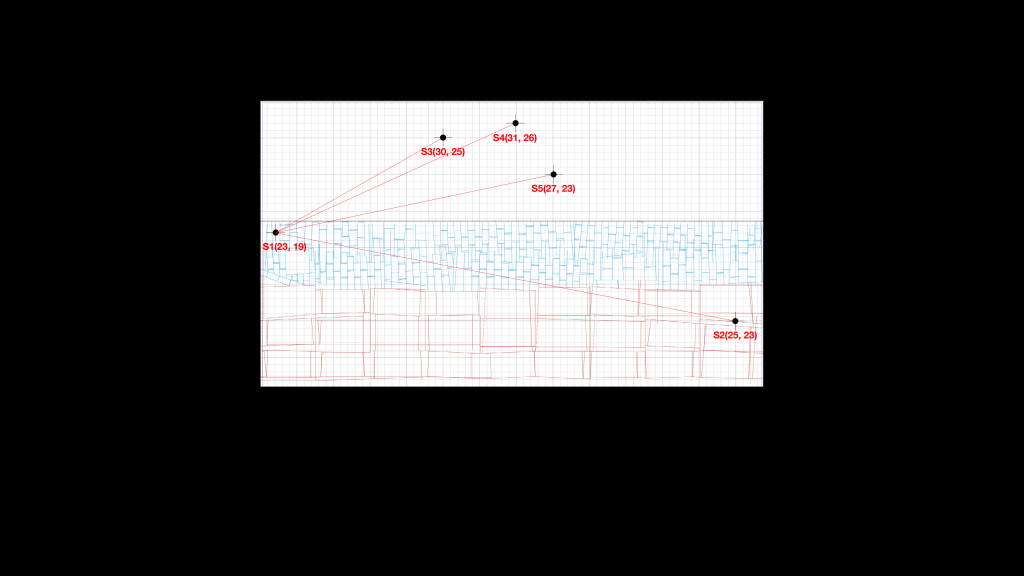
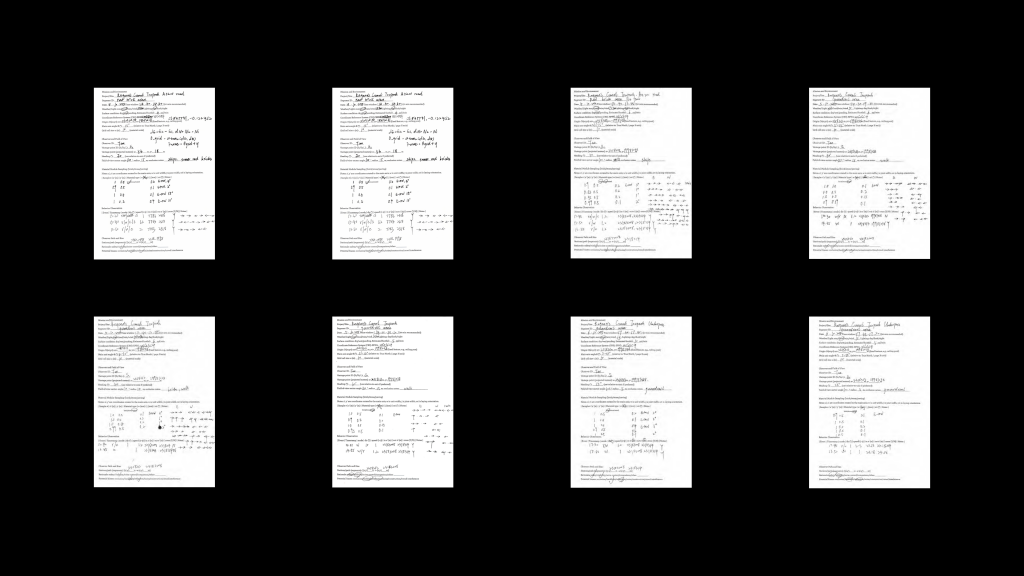
I placed the drafts from each observation form—where I used arrows to record people flow direction and counts—onto the grid as well, to indicate how many people passed by during an observation period.
WEEK_ 03