Process notes
This stage records the turn from CONTACT into grid systems and timetable design. The question became more specific: how do resolution, density, spacing, and media change what a timetable allows a reader to compare?
The written response remains above as the formal submission document. The notes below split the presentations into visible evidence of contextual research, studio testing, and feedback-led redirection.
Selected process fragments
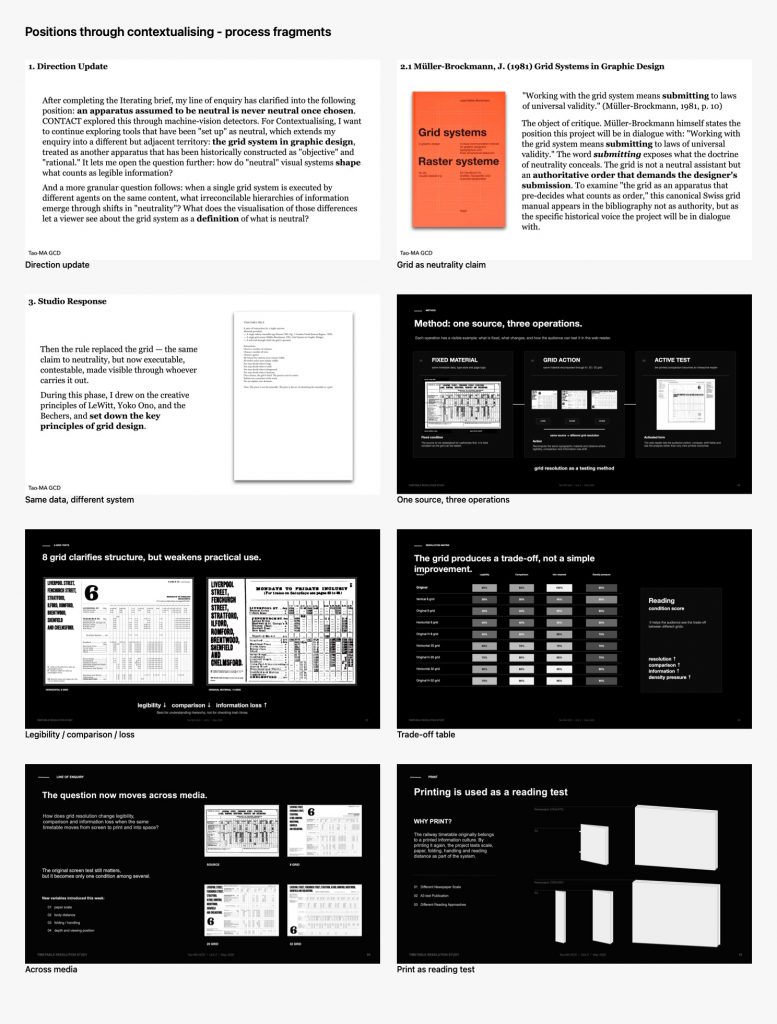
- Direction update: from machine vision to the grid — After CONTACT, the enquiry turned toward another apparatus of graphic communication: the grid, especially where it claims to organise information neutrally. Source PDF, page 3.
- The grid as a claim of neutrality — Muller-Brockmann became an object of critique rather than a style reference. The question was how a grid asks information to submit to a specific order. Source PDF, page 7.
- Studio response: same data, different system — The studio response kept the timetable source stable and changed the organising system, making the grid visible as an operation rather than an invisible support. Source PDF, page 15.
- One source, three operations — The method became simple: keep one source, then test extraction, grid translation, and active reading so the enquiry did not become too general. Source PDF, page 5.
- Legibility, comparison, information loss — The 8-grid version clarifies structure but weakens practical use. Higher order does not automatically mean better reading; each resolution produces a trade-off. Source PDF, page 8.
- Resolution as a trade-off table — I began scoring what each system enables and removes: reading, comparison, information loss, and historical texture. Source PDF, page 11.
- The question moves across media — The final presentation expanded the test across screen, print, and scale. The timetable became a graphic system for organising time. Source PDF, page 4.
- Printing as a reading test — Printing tested the body of the reader: distance, scale, folding, and handling. The project moved from screen comparison into material reading conditions. Source PDF, page 10.
Full presentation archives
The embedded PDFs below are kept as the complete records for Week 3, Week 4, and Week 5.